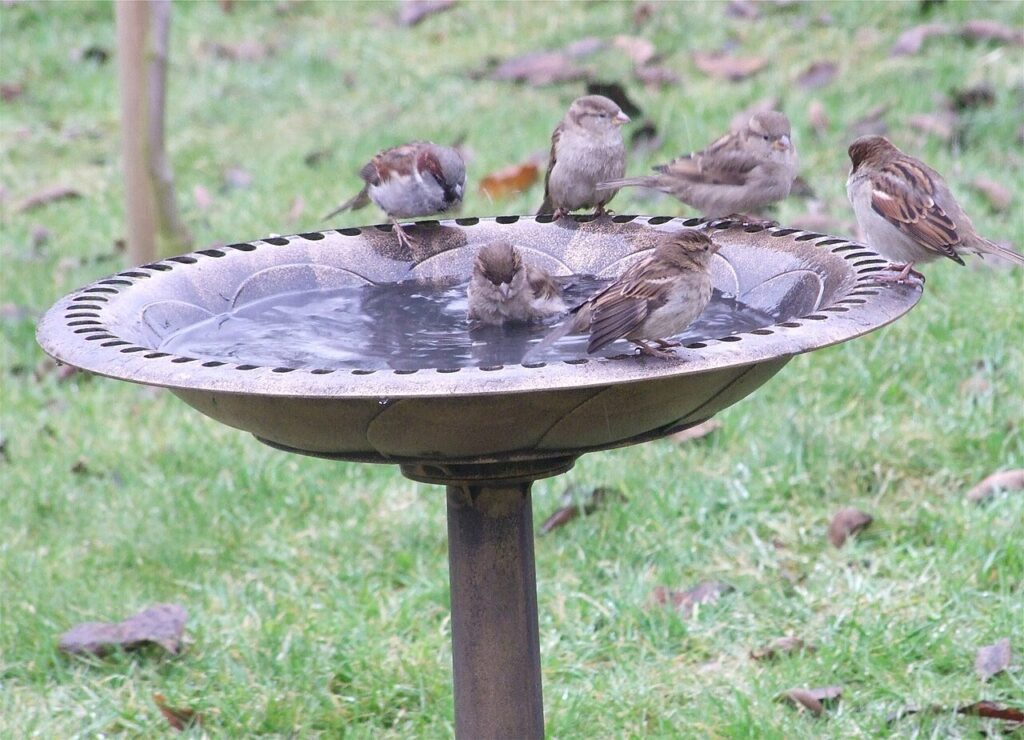
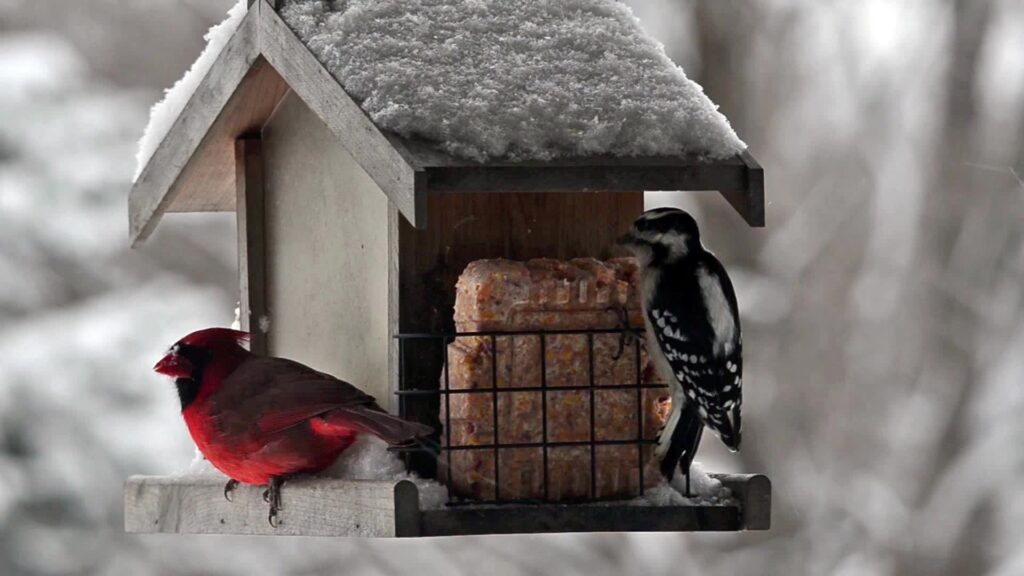
Across the United States, 23 of 50 common backyard birds have clearly declined since 1966, and 11 have clearly increased, according to our analysis of the U.S. Geological Survey’s newest Breeding Bird Survey results. The losers are mostly the birds of open yards and farm edges: house sparrows, grackles, blackbirds, starlings and towhees. The winners are feeder regulars: nuthatches, wrens, woodpeckers, titmice, bluebirds and cardinals. Below is what changed nationally and a state-by-state table for 49 states.
The short version
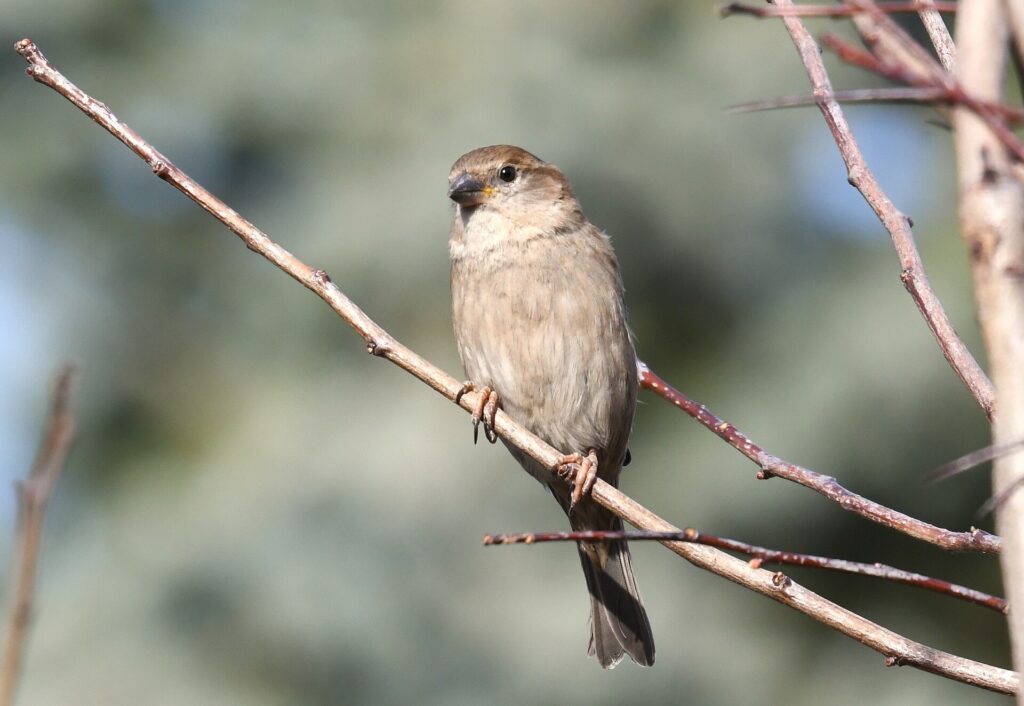
- House sparrows are down almost everywhere: clearly declining in 41 of the 47 states with enough data, and rising in none.
- Blackbirds are falling: red-winged blackbirds are clearly down in 33 states, common grackles in 32 and European starlings in 30.
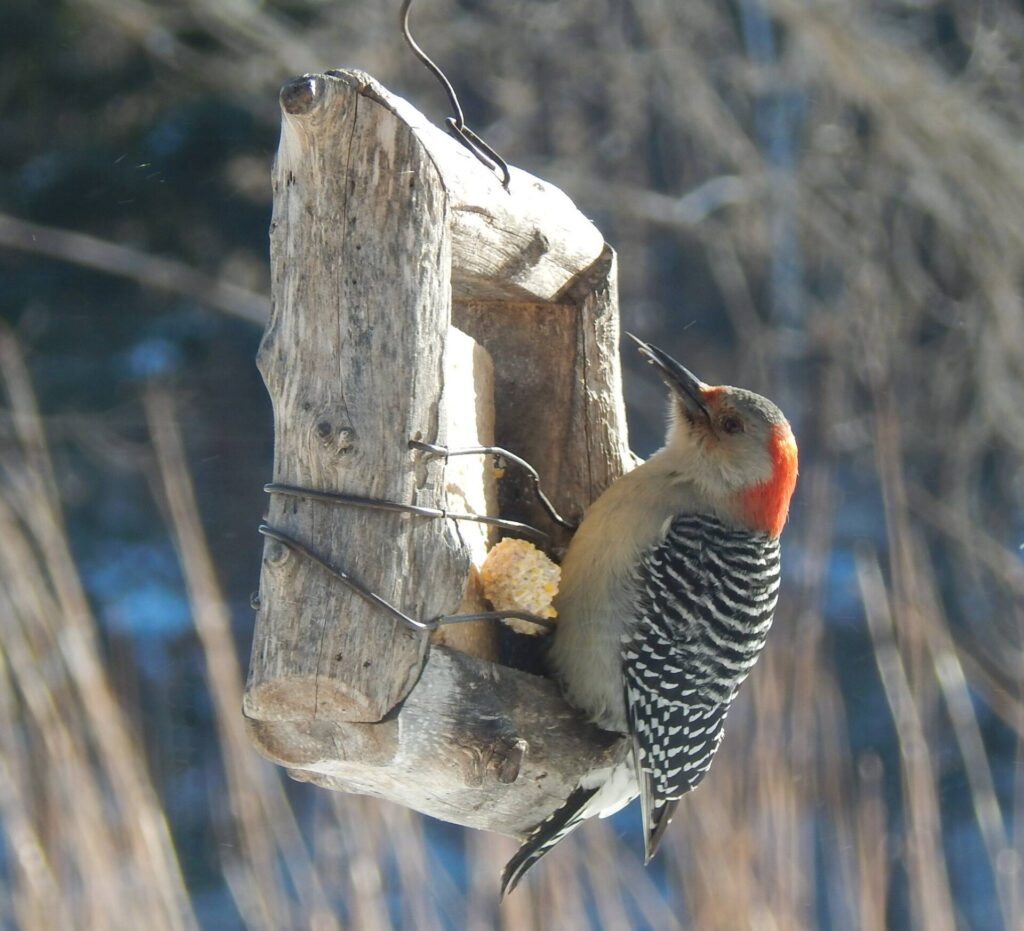
- Feeder birds are winning: the red-bellied woodpecker, Carolina wren and white-breasted nuthatch are clearly up in 20 or more states each and clearly down in none.
- Hardest-hit state: Oregon, where 16 of 27 backyard birds with reliable data are clearly down and only one is clearly up.
Where these numbers come from
The North American Breeding Bird Survey is a volunteer count run in the U.S. by the USGS. Each June, observers drive fixed roadside routes and count every bird they see or hear at 50 stops. USGS scientists turn those counts into a yearly trend for each species in each state. We used the 2026 release, covering 1966 to 2025, and kept only the estimates USGS rates as reliable: at least 14 routes, enough birds and enough precision (no data-quality warning). “Clearly up” or “clearly down” means the trend’s 95% credible range sits entirely above or below zero, using USGS’s own significance flag.
Two limits matter. This is a June count, so it tracks birds that nest in a state, not winter visitors at your feeder. And a trend shows how much a bird changed, not why.
The backyard birds declining most across the U.S.
| Bird | U.S. trend per year | Change since 1966* | States where clearly down |
|---|---|---|---|
| House sparrow | −2.5% | about 77% fewer | 41 of 47 |
| Common grackle | −1.7% | about 64% fewer | 32 of 39 |
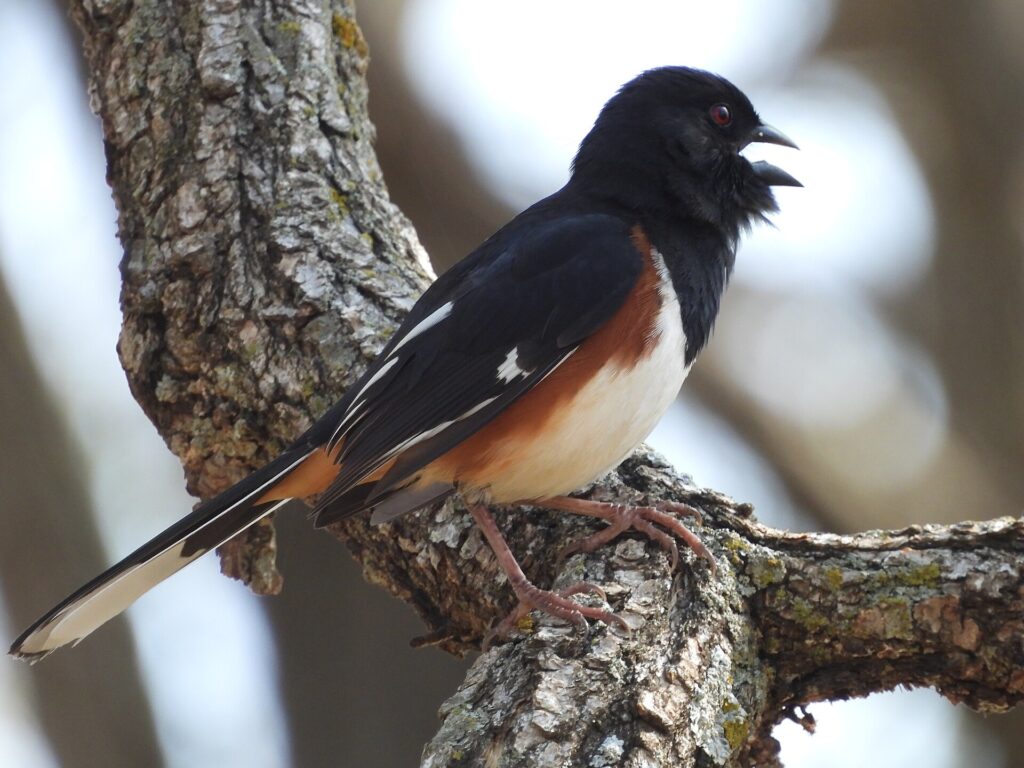
| Eastern towhee | −1.6% | about 61% fewer | 21 of 25 |
| Northern flicker | −1.2% | about 52% fewer | 28 of 37 |
| Brown thrasher | −1.0% | about 46% fewer | 23 of 28 |
| Northern mockingbird | −0.9% | about 43% fewer | 17 of 32 |
| European starling | −0.9% | about 43% fewer | 30 of 47 |
Source: U.S. Geological Survey, The North American Breeding Bird Survey, Analysis Results 1966–2025 (public domain), file BBS_Core_Trends_1966-2025.csv. Spark Lark analysis. On a phone, swipe the table sideways.
The backyard birds doing better
| Bird | U.S. trend per year | Change since 1966* | States where clearly up |
|---|---|---|---|
| White-breasted nuthatch | +1.2% | about 2.1 times as many | 20 of 27 |
| Carolina wren | +1.1% | about 94% more | 20 of 24 |
| Red-bellied woodpecker | +0.8% | about 57% more | 22 of 27 |
| Eastern bluebird | +0.7% | about 55% more | 18 of 30 |
| Tufted titmouse | +0.6% | about 44% more | 18 of 29 |
| Northern cardinal | +0.1% | about 8% more | 18 of 34 |
*Change since 1966 is our calculation: the yearly trend compounded over 59 years. Treat it as a rough size of the change. The Eurasian collared-dove, a non-native bird that spread across the country after the 1980s, is up more than tenfold and left out of this table.
Backyard bird trends in every state
For each state, the table counts how many of our 54 backyard birds have reliable USGS data there, how many are clearly down or clearly up since 1966, and the biggest mover each way. Hawaii is not part of the survey’s core results, and Rhode Island has too few routes for a reliable estimate.
| State | Backyard birds with reliable data | Clearly down | Clearly up | Biggest drop | Biggest gain |
|---|---|---|---|---|---|
| Alabama | 25 | 14 | 7 | House Sparrow (-4.4% a year, about 93% fewer) | Eastern Phoebe (+2.5% a year, about 4.4 times as many) |
| Alaska | 4 | 0 | 0 | None | None |
| Arizona | 25 | 8 | 4 | House Sparrow (-2.8% a year, about 82% fewer) | Northern House Wren (+2.5% a year, about 4.2 times as many) |
| Arkansas | 26 | 14 | 4 | House Sparrow (-4% a year, about 91% fewer) | Carolina Wren (+1% a year, about 76% more) |
| California | 29 | 11 | 4 | White-crowned Sparrow (-2.5% a year, about 78% fewer) | Anna's Hummingbird (+1% a year, about 83% more) |
| Colorado | 21 | 4 | 3 | House Sparrow (-1.5% a year, about 59% fewer) | Common Grackle (+2.4% a year, about 4.2 times as many) |
| Connecticut | 32 | 8 | 7 | Northern Flicker (-3.7% a year, about 89% fewer) | House Finch (+6.8% a year, more than 10 times as many) |
| Delaware | 30 | 5 | 11 | House Sparrow (-3% a year, about 84% fewer) | Eastern Bluebird (+5.2% a year, more than 10 times as many) |
| Florida | 20 | 9 | 5 | House Sparrow (-6.1% a year, about 97% fewer) | Barn Swallow (+3% a year, about 5.8 times as many) |
| Georgia | 27 | 12 | 10 | House Sparrow (-4.3% a year, about 92% fewer) | Barn Swallow (+2.4% a year, about 4.1 times as many) |
| Idaho | 21 | 3 | 1 | House Sparrow (-2.1% a year, about 72% fewer) | Brown-headed Cowbird (+1.3% a year, about 2.2 times as many) |
| Illinois | 34 | 11 | 13 | House Sparrow (-2.7% a year, about 80% fewer) | Cedar Waxwing (+5.1% a year, more than 10 times as many) |
| Indiana | 33 | 8 | 7 | House Sparrow (-2.7% a year, about 80% fewer) | Tree Swallow (+6.2% a year, more than 10 times as many) |
| Iowa | 28 | 11 | 12 | Northern Flicker (-3.2% a year, about 85% fewer) | Cedar Waxwing (+5.2% a year, more than 10 times as many) |
| Kansas | 28 | 10 | 10 | House Sparrow (-2.8% a year, about 82% fewer) | Chipping Sparrow (+5.7% a year, more than 10 times as many) |
| Kentucky | 33 | 13 | 8 | House Sparrow (-3.4% a year, about 87% fewer) | Northern House Wren (+5.5% a year, more than 10 times as many) |
| Louisiana | 22 | 8 | 8 | House Sparrow (-3.8% a year, about 90% fewer) | Barn Swallow (+5.8% a year, more than 10 times as many) |
| Maine | 24 | 12 | 3 | Brown-headed Cowbird (-4.9% a year, about 95% fewer) | Mourning Dove (+3% a year, about 5.6 times as many) |
| Maryland | 35 | 15 | 12 | Common Grackle (-3.4% a year, about 87% fewer) | House Finch (+12.1% a year, more than 10 times as many) |
| Massachusetts | 32 | 13 | 10 | Eastern Towhee (-3.8% a year, about 90% fewer) | Carolina Wren (+9.2% a year, more than 10 times as many) |
| Michigan | 33 | 11 | 13 | Common Grackle (-2.1% a year, about 72% fewer) | Red-bellied Woodpecker (+4.8% a year, more than 10 times as many) |
| Minnesota | 29 | 9 | 8 | House Sparrow (-2.8% a year, about 81% fewer) | Red-breasted Nuthatch (+3.2% a year, about 6.5 times as many) |
| Mississippi | 24 | 10 | 10 | Common Grackle (-4.2% a year, about 92% fewer) | Eastern Phoebe (+4% a year, more than 10 times as many) |
| Missouri | 35 | 14 | 11 | House Sparrow (-4.2% a year, about 92% fewer) | Cedar Waxwing (+4.7% a year, more than 10 times as many) |
| Montana | 21 | 5 | 4 | Chipping Sparrow (-1.7% a year, about 64% fewer) | Cedar Waxwing (+4.5% a year, more than 10 times as many) |
| Nebraska | 22 | 6 | 7 | House Sparrow (-2.6% a year, about 79% fewer) | Tree Swallow (+6.9% a year, more than 10 times as many) |
| Nevada | 12 | 1 | 6 | Mourning Dove (-1.2% a year, about 51% fewer) | Spotted Towhee (+3.7% a year, about 8.7 times as many) |
| New Hampshire | 29 | 14 | 10 | European Starling (-2.9% a year, about 82% fewer) | Tufted Titmouse (+10.2% a year, more than 10 times as many) |
| New Jersey | 33 | 16 | 8 | Eastern Towhee (-3.9% a year, about 90% fewer) | Carolina Wren (+6.8% a year, more than 10 times as many) |
| New Mexico | 22 | 10 | 1 | Mountain Chickadee (-2.6% a year, about 79% fewer) | Great-tailed Grackle (+3.9% a year, about 9.8 times as many) |
| New York | 34 | 16 | 10 | Eastern Towhee (-2.3% a year, about 75% fewer) | Red-bellied Woodpecker (+7.5% a year, more than 10 times as many) |
| North Carolina | 32 | 10 | 11 | House Sparrow (-3.6% a year, about 89% fewer) | House Finch (+9.9% a year, more than 10 times as many) |
| North Dakota | 20 | 5 | 7 | American Crow (-2.2% a year, about 74% fewer) | Tree Swallow (+2.8% a year, about 5.1 times as many) |
| Ohio | 35 | 11 | 14 | House Sparrow (-2.4% a year, about 76% fewer) | House Finch (+11.9% a year, more than 10 times as many) |
| Oklahoma | 27 | 11 | 9 | Baltimore Oriole (-3.1% a year, about 84% fewer) | Carolina Wren (+1.7% a year, about 2.8 times as many) |
| Oregon | 27 | 16 | 1 | American Goldfinch (-2.9% a year, about 82% fewer) | California & Woodhouse's Scrub-Jay (+1.1% a year, about 95% more) |
| Pennsylvania | 36 | 16 | 12 | Common Grackle (-2.3% a year, about 74% fewer) | House Finch (+10.4% a year, more than 10 times as many) |
| Rhode Island | 0 | – | – | Not enough survey data for a reliable estimate | |
| South Carolina | 25 | 11 | 6 | House Sparrow (-4.6% a year, about 94% fewer) | American Goldfinch (+4.2% a year, more than 10 times as many) |
| South Dakota | 19 | 4 | 5 | Black-capped Chickadee (-1.3% a year, about 54% fewer) | Tree Swallow (+4.4% a year, more than 10 times as many) |
| Tennessee | 30 | 12 | 10 | Common Grackle (-3.7% a year, about 89% fewer) | White-breasted Nuthatch (+4.4% a year, more than 10 times as many) |
| Texas | 24 | 6 | 8 | House Sparrow (-2.5% a year, about 78% fewer) | Barn Swallow (+3% a year, about 5.6 times as many) |
| Utah | 16 | 4 | 4 | European Starling (-2.1% a year, about 72% fewer) | Northern Mockingbird (+2.8% a year, about 5.1 times as many) |
| Vermont | 29 | 13 | 5 | House Sparrow (-3.1% a year, about 84% fewer) | Tufted Titmouse (+10.1% a year, more than 10 times as many) |
| Virginia | 35 | 16 | 8 | House Sparrow (-4.8% a year, about 94% fewer) | House Finch (+9.5% a year, more than 10 times as many) |
| Washington | 25 | 6 | 4 | Chipping Sparrow (-1.7% a year, about 63% fewer) | Black-headed Grosbeak (+2.7% a year, about 4.7 times as many) |
| West Virginia | 33 | 14 | 6 | House Sparrow (-3% a year, about 84% fewer) | Tree Swallow (+7.5% a year, more than 10 times as many) |
| Wisconsin | 32 | 12 | 10 | House Sparrow (-2.3% a year, about 74% fewer) | Red-bellied Woodpecker (+4% a year, more than 10 times as many) |
| Wyoming | 17 | 2 | 3 | Chipping Sparrow (-1% a year, about 43% fewer) | Brown-headed Cowbird (+1.5% a year, about 2.3 times as many) |
Source: U.S. Geological Survey, The North American Breeding Bird Survey, Analysis Results 1966–2025 (public domain), file BBS_Core_Trends_1966-2025.csv. Spark Lark analysis. On a phone, swipe the table sideways.
Which birds we counted as backyard birds
We used 54 species that commonly nest in U.S. yards, parks and neighborhoods or visit feeders: cardinals, jays, robins, doves, finches and goldfinches, chickadees, titmice, bushtits, woodpeckers and flickers, nuthatches, wrens, mockingbirds, catbirds and thrashers, bluebirds, sparrows, starlings, blackbirds, cowbirds and grackles, orioles, hummingbirds, phoebes, swallows and martins, waxwings, crows, grosbeaks, towhees, scrub-jays and Steller’s jays, buntings and collared-doves. Not every species lives in every state, so each state’s count is different.
What you can do in your own yard
- Count your feeder birds this winter with Project FeederWatch. Our free FeederWatch tally sheet makes it easy.
- Learn who’s visiting with our backyard bird ID chart by color.
- Keep track of every species you see with the backyard bird life list.
- Make your windows safer for birds: why birds crash into windows.
How we built this page
- Source file: BBS_Core_Trends_1966-2025.csv from the USGS ScienceBase data release (doi:10.5066/P1OSNSFC), state rows and the United States row.
- Reliable data only: rows with a blank USGS credibility code (at least 14 routes, at least 1 bird per route, enough precision).
- “Clearly up/down” = the USGS significance field (95% credible interval excludes zero).
- Change since 1966 = (1 + yearly trend) to the 59th power, minus 1; gains over tenfold are shown as “more than 10 times as many.”